Banking Analytics
Customers & Transactions
Banking data analysis built with Power BI, focused on customers, products and transactions. Interactive dashboard with two views: customer and product analysis with income-level segmentation and overdue amounts, and a general transaction analysis by channel, city and time evolution across multiple currencies. Project recognised with 2nd Runner Up (Bronze) at the FP20 Analytics Challenge 27 — Spanish category.
Official certificate — click to enlarge

Customer and Product Analysis
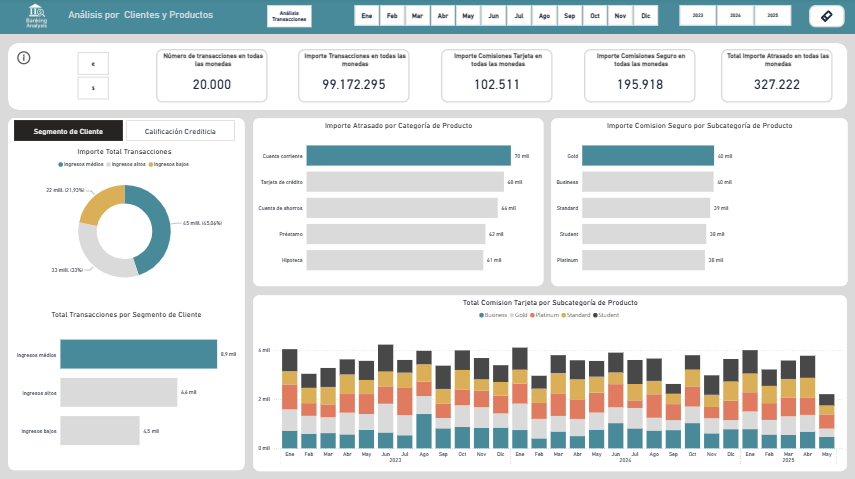
The first view segments the customer base by income level (low, medium, high) and cross-references that segmentation with total transaction amount and overdue amount by product category. The five header KPIs summarise the dataset: 20,000 transactions, 99,172,295 in transacted amount, 102,511 in card fees, 195,918 in insurance fees and 327,222 in overdue amount, across all currencies.
The overdue amount by product category chart identifies where default risk concentrates — current account, credit card, savings account, loan and mortgage — while the insurance fee by product subcategory breakdown (Gold, Business, Standard, Student, Platinum) shows which product segments generate the most recurring income.
A toggle button switches between the view by customer segment and the view by credit rating, reusing the same layout with a different analysis dimension. Card fee by subcategory is also visualised as a stacked monthly evolution across 2023-2025.
- Customer segmentation by income level (low / medium / high)
- Toggle between customer segment and credit rating
- Overdue amount by product category
- Insurance and card fee by product subcategory
- Year and month selector, with multi-currency view (€ / $)
General Transaction Analysis
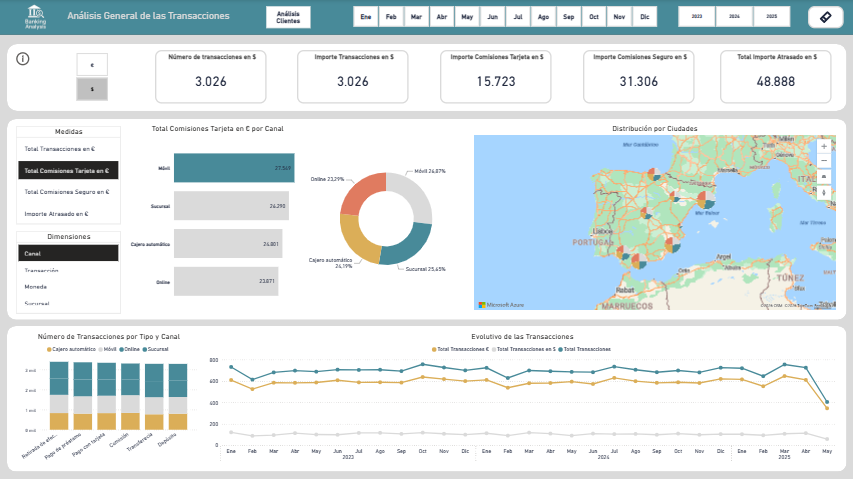
The second view digs into operational behaviour: which channel is used most, where transactions happen and how they evolve over time. A side panel of measures and dimensions lets you pick which metric to analyse (transactions, card fees, insurance fees, overdue amount) and which dimension to cross it with (channel, transaction, currency, branch).
The card fee by channel chart compares mobile, branch, ATM and online, with a donut translating that split into percentages. The distribution by city map geolocates activity across the Iberian Peninsula and southern France, useful for spotting geographic concentration in operations.
Finally, the transaction evolution chart combines the business's three currencies on a single timeline (2023-2025), and the breakdown by type and channel (application, loan payment, card payment, enquiry, transfer, deposit) shows which operations dominate each channel.
- Selectable measures and dimensions panel (channel, transaction, currency, branch)
- Card fee by channel with donut distribution
- Geographic map of distribution by city
- Number of transactions by type and channel
- Multi-currency transaction evolution 2023-2025
Need a similar dashboard for your business?
I can design a custom Power BI dashboard with the level of detail you need, tailored to your data and the decisions you make every week.