Candy Market
Share Analysis
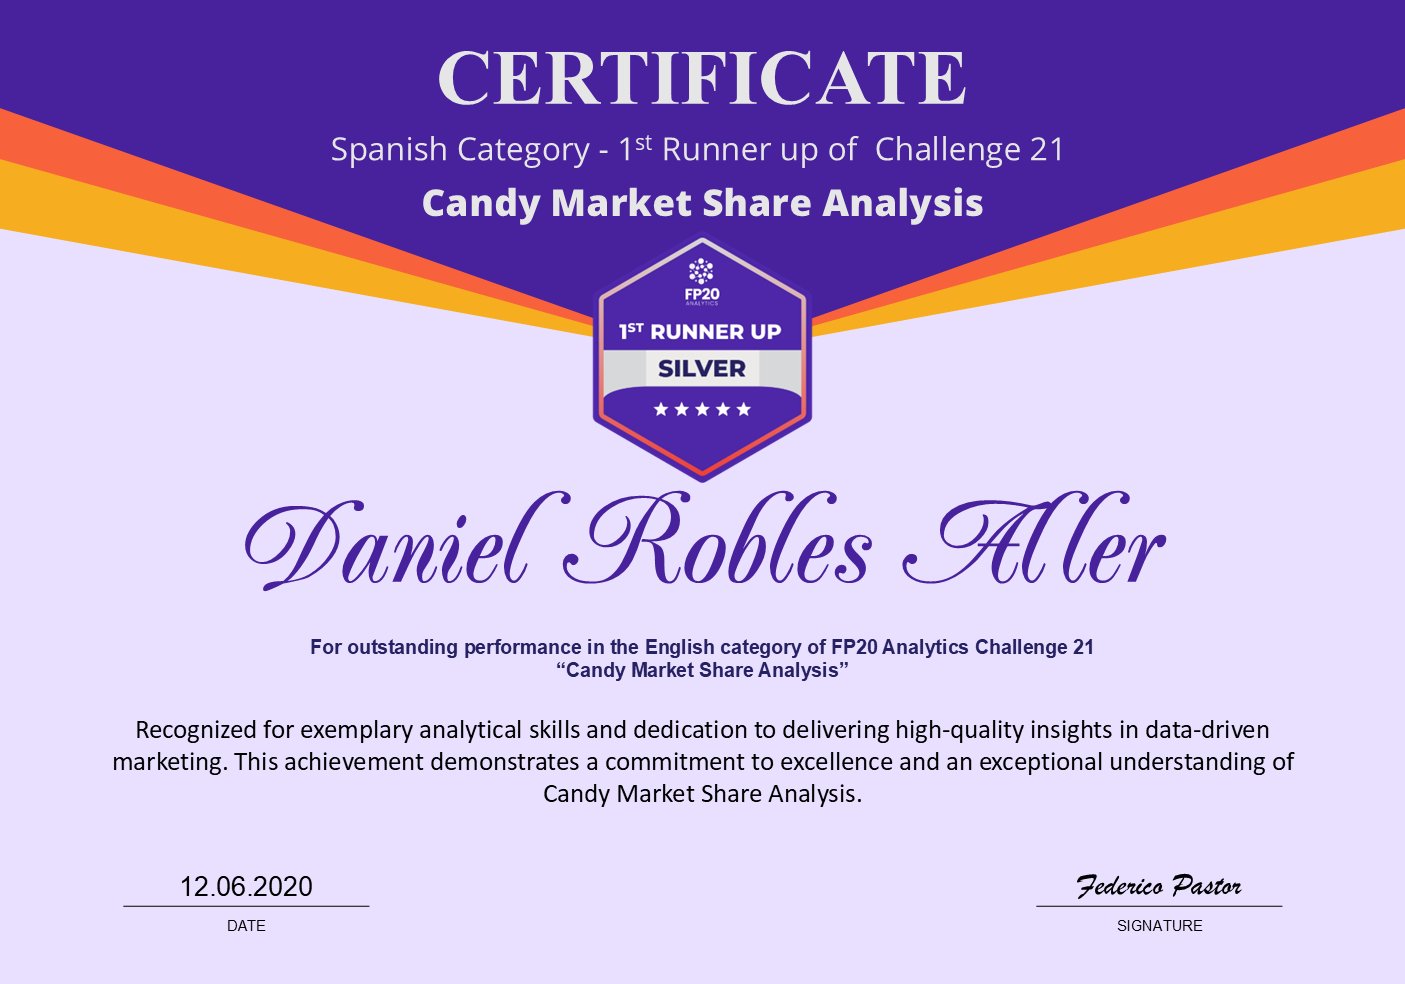
A comprehensive analysis of the European confectionery market built in Power BI. The interactive dashboard includes two views: a general overview with KPIs and sales trends, and a detailed analysis with forecasting, segmentation by category, distribution channel, manufacturer and packaging type. Recognised with the 1st Runner Up (Silver) award at FP20 Analytics Challenge 21 — Spanish category.
Official certificate — click to enlarge
General Overview — Executive market view
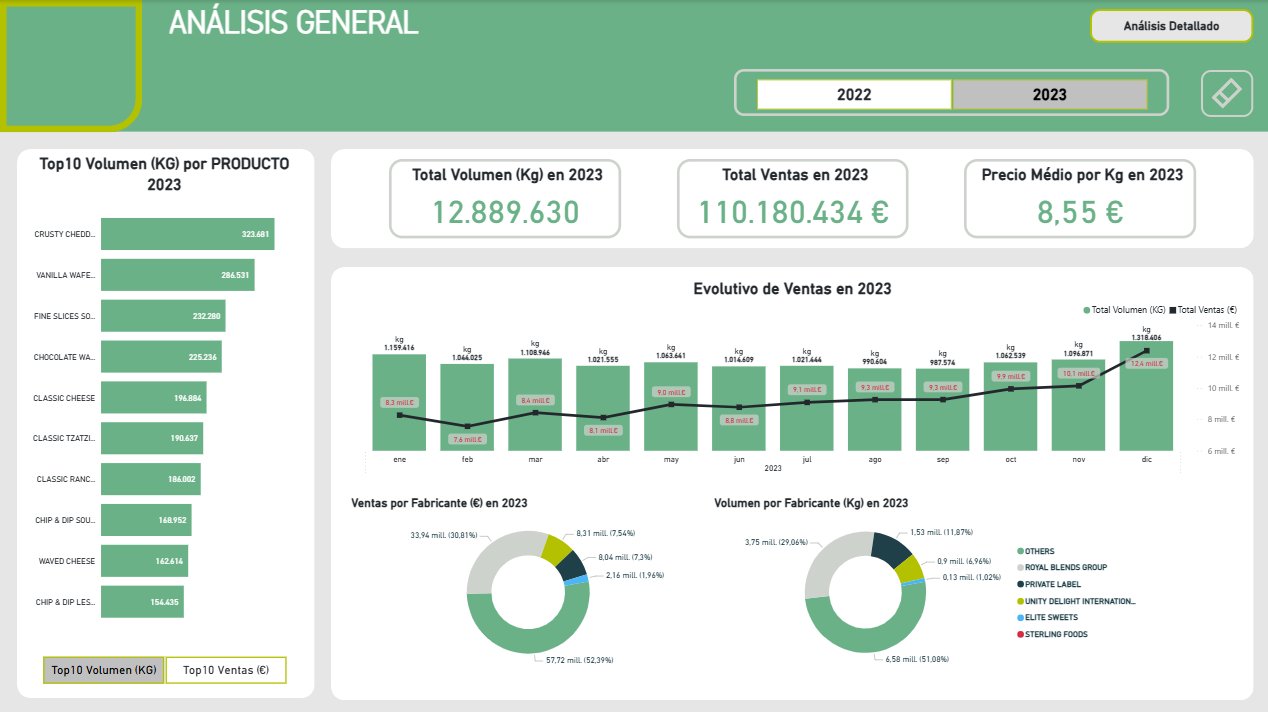
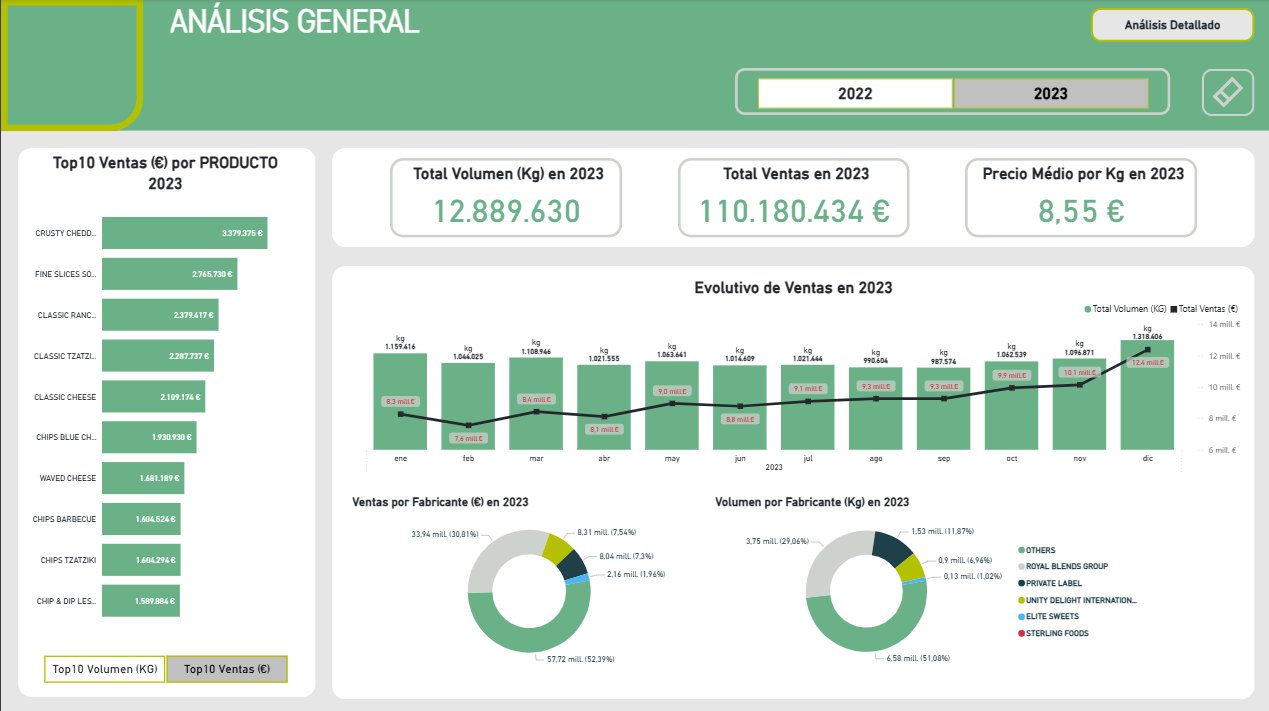
The first dashboard view provides an executive overview of the European confectionery market. Three primary KPIs show total volume in kg, sales in euros and average price per kg for the selected year.
The monthly sales trend combines volume bars with a sales line, making it easy to identify seasonality and demand peaks throughout the year. The 2022-2023 comparison is activated using the year selectors in the header.
The manufacturer charts display both sales and volume distribution, revealing which brands lead the market and which command a higher average price per kg — key information for pricing and positioning decisions.
- Top 10 products by volume (kg) and sales (€) with toggle
- Dynamic KPIs by year: volume, sales and average price
- Monthly trend with dual volume/sales axis
- Manufacturer distribution by value and volume
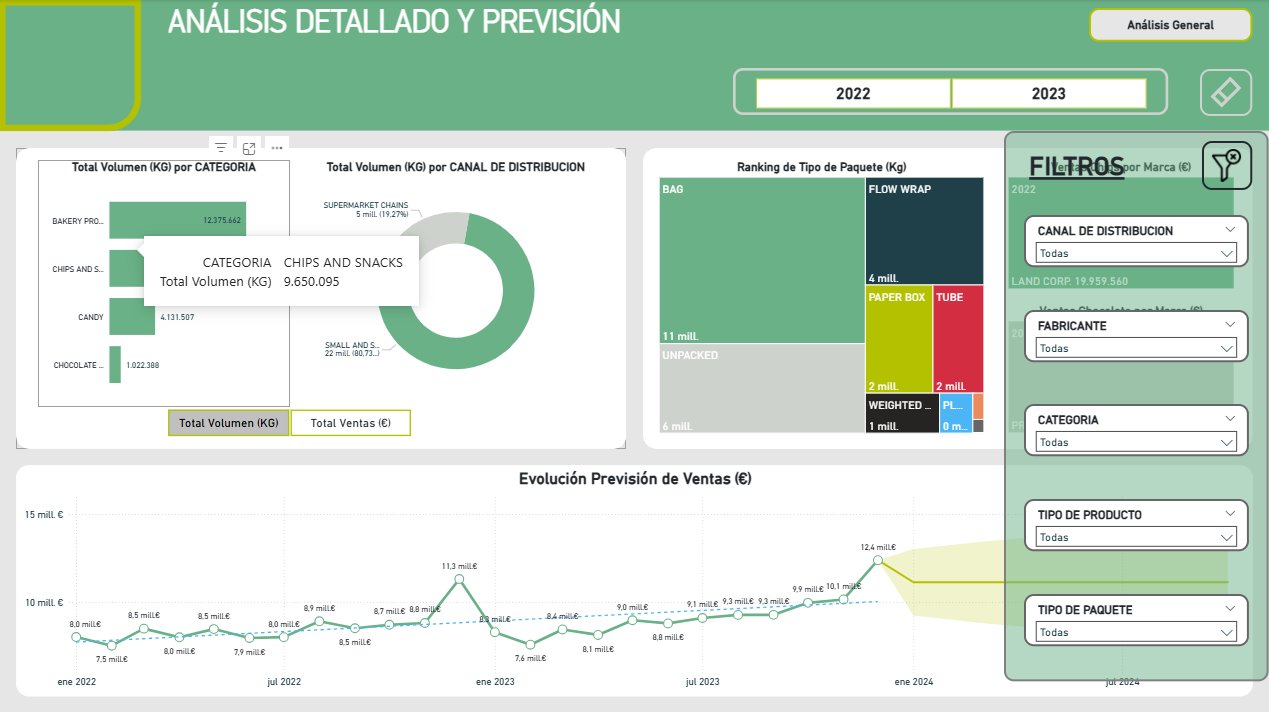
Detailed Analysis and Sales Forecasting
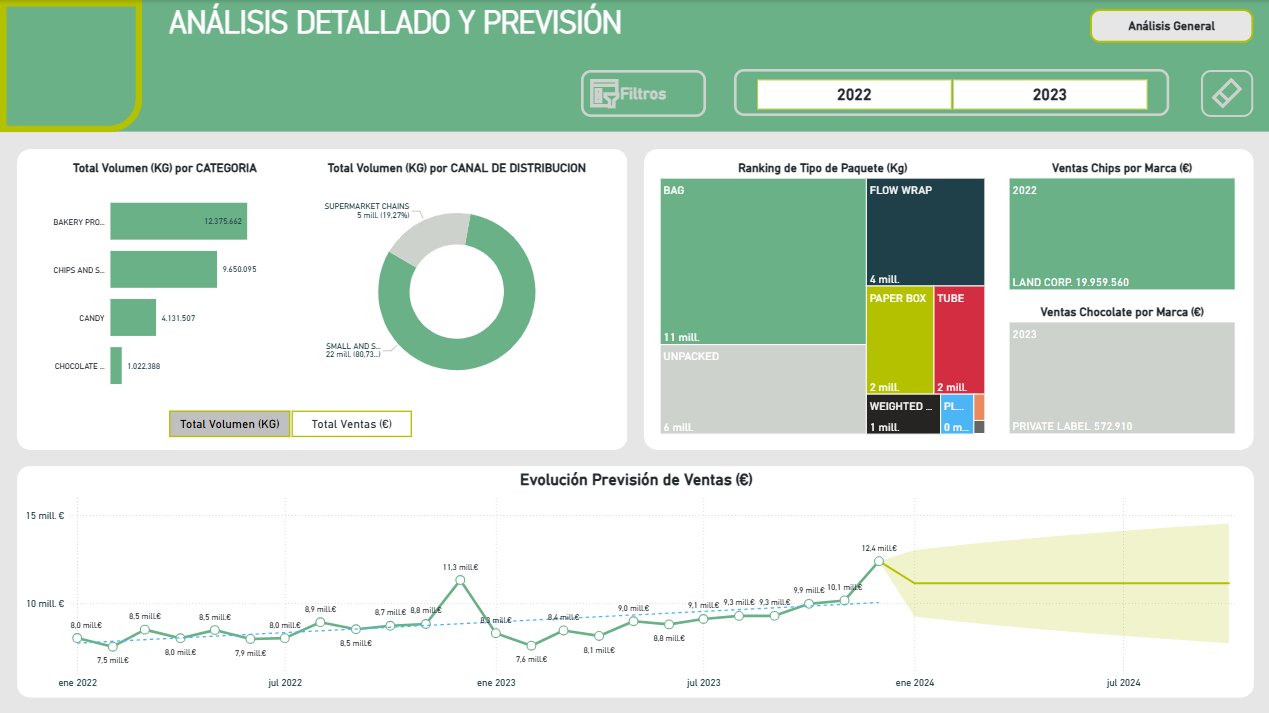
The second view drills deeper into segment analysis and incorporates a sales forecast model through mid-2024, with confidence bands visualised in the trend chart.
The expandable filter panel allows segmentation by distribution channel, manufacturer, category, product type and packaging type — all applicable simultaneously for combined analysis.
The packaging type ranking in treemap format reveals which formats concentrate the most volume, while the brand sales charts within each category (chips, chocolate) enable detailed competitive analysis.
- Sales forecast with confidence bands to July 2024
- Segmentation across 5 dimensions with combinable filters
- Packaging type ranking in interactive treemap
- Sales by brand within each product category
- Enriched tooltips with drill-through detail
Need a similar dashboard for your business?
I can design a custom Power BI dashboard with the level of detail you need, adapted to your data and the decisions you make every week.